TF2 Unusual unbox rate
Information
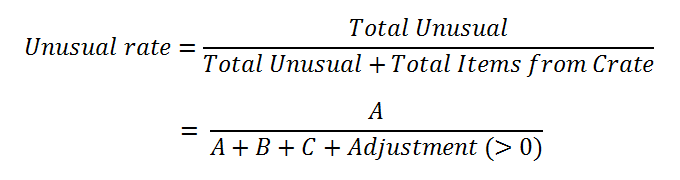
This page is compiled manually through data gathered from "May 2012 Item Statistics"Who said it was 1%?
Historical Data
Column A does not include "Origin: Steam Support" nor Duplicate copies
Column B does not include "Origin: Steam Support" nor Duplicate copies
Column C does not include "Quality: Strange" nor Duplicate copies, and only includes "Origin: Found in Crate"
Column C is an underestimate because
- Paints get consumed
- Tags get consumed
- Strange Parts get consumed
- Hats get crafted away
- Weapons get crafted away
- "Origin: Found in Crate" sometimes get changed to "Origin: Traded" for items before original_id 580,000,000
An underestimate of a number C means an overestimate of a number 1/C.
That means, the calculated unusual unbox rate is an Upper Bound.
Keep in mind that old crates mainly contain Paints, and hence their upper bounds are higher. The significantly higher upper bound does not necessarily imply that actual rate is higher.
Also keep in mind that Strange Parts were introduced in the March 22, 2012 Patch.
The last "Paint Crate" was removed from the drop system in the June 23, 2011 Patch.
Based on known data, the present rate cannot possibly be over 0.66%.
| A | B | C | A/(A+B+C) | ||
| distinct original_id range | Unusual | Strange / Strange Festive | Hats/Weapons/Haunted (Huge Underestimate) | Unusual Drop Rate (Upper bound) | Convert original_id to Date |
| 850,000,000 | 190 | 23,304 | 8,557 | 0.59% | |
| 840,000,000 | 526 | 66,263 | 20,960 | 0.60% | May 17, 2012 Patch |
| 830,000,000 | 538 | 68,605 | 19,801 | 0.60% | |
| 820,000,000 | 618 | 70,957 | 18,194 | 0.69% | |
| 810,000,000 | 628 | 76,285 | 17,606 | 0.66% | April 27, 2012 Patch |
| 800,000,000 | 616 | 71,902 | 15,798 | 0.70% | |
| 790,000,000 | 565 | 72,297 | 15,126 | 0.64% | |
| 780,000,000 | 552 | 70,889 | 14,090 | 0.65% | |
| 770,000,000 | 588 | 73,609 | 13,782 | 0.67% | March 28, 2012 Patch |
| 760,000,000 | 612 | 77,791 | 12,828 | 0.67% | March 22, 2012 Patch |
| 750,000,000 | 539 | 65,846 | 9,915 | 0.71% | |
| 740,000,000 | 546 | 69,546 | 9,915 | 0.68% | |
| 730,000,000 | 572 | 74,856 | 10,791 | 0.66% | |
| 720,000,000 | 552 | 75,996 | 10,199 | 0.64% | February 23, 2012 Patch |
| 710,000,000 | 521 | 76,321 | 9,483 | 0.60% | |
| 700,000,000 | 521 | 68,952 | 8,927 | 0.66% | |
| 690,000,000 | 432 | 58,343 | 7,946 | 0.65% | February 2, 2012 Patch |
| 680,000,000 | 443 | 51,361 | 7,178 | 0.75% | |
| 670,000,000 | 466 | 52,644 | 7,014 | 0.78% | |
| 660,000,000 | 444 | 51,771 | 6,832 | 0.75% | |
| 650,000,000 | 424 | 48,705 | 6,481 | 0.76% | January 11, 2012 Patch |
| 640,000,000 | 652 | 44,265 | 62,751 | 0.61% | |
| 630,000,000 | 815 | 45,836 | 76,115 | 0.66% | |
| 620,000,000 | 675 | 34,692 | 82,015 | 0.58% | |
| 610,000,000 | 857 | 38,398 | 115,327 | 0.55% | |
| 600,000,000 | 486 | 47,744 | 13,870 | 0.78% | December 15, 2011 Patch |
| 590,000,000 | 574 | 62,284 | 6,916 | 0.82% | December 1, 2011 Patch |
| 580,000,000 | 517 | 50,335 | 6,266 | 0.91% | |
| 570,000,000 | 502 | 48,687 | 6,534 | 0.90% | |
| 560,000,000 | 663 | 64,332 | 9,313 | 0.89% | |
| 550,000,000 | 665 | 66,618 | 10,274 | 0.86% | |
| 540,000,000 | 680 | 68,806 | 9,882 | 0.86% | October 25, 2011 Patch |
| 530,000,000 | 719 | 64,095 | 9,500 | 0.97% | |
| 520,000,000 | 624 | 66,645 | 9,642 | 0.81% | |
| 510,000,000 | 556 | 68,569 | 8,462 | 0.72% | October 13, 2011 Patch |
| 500,000,000 | 611 | 76,207 | 8,869 | 0.71% | |
| 490,000,000 | 623 | 79,905 | 9,088 | 0.70% | |
| 480,000,000 | 643 | 81,565 | 9,567 | 0.70% | |
| 470,000,000 | 639 | 76,938 | 9,403 | 0.73% | |
| 460,000,000 | 624 | 83,632 | 9,839 | 0.66% | |
| 450,000,000 | 607 | 79,351 | 9,157 | 0.68% | |
| 440,000,000 | 496 | 64,632 | 7,733 | 0.68% | |
| 430,000,000 | 520 | 65,408 | 8,159 | 0.70% | |
| 420,000,000 | 444 | 54,057 | 7,798 | 0.71% | August 18, 2011 Patch |
| 410,000,000 | 483 | 51,800 | 7,913 | 0.80% | |
| 400,000,000 | 433 | 53,497 | 8,319 | 0.70% | |
| 390,000,000 | 468 | 56,588 | 8,624 | 0.71% | |
| 380,000,000 | 504 | 53,235 | 8,788 | 0.81% | |
| 370,000,000 | 535 | 63,066 | 10,820 | 0.72% | |
| 360,000,000 | 612 | 50,382 | 30,629 | 0.75% | July 12, 2011 Patch |
| 350,000,000 | 651 | 35,203 | 37,559 | 0.89% | |
| 340,000,000 | 610 | 34,736 | 35,783 | 0.86% | July 1, 2011 Patch |
| 330,000,000 | 410 | 37,577 | 12,173 | 0.82% | |
| 320,000,000 | 449 | 10,486 | 16,320 | 1.65% | June 23, 2011 Patch |
| 310,000,000 | 307 | 0 | 12,961 | 2.31% | |
| 300,000,000 | 413 | 0 | 17,722 | 2.28% | |
| 290,000,000 | 573 | 0 | 21,121 | 2.64% | |
| 280,000,000 | 1,867 | 0 | 20,888 | 8.20% | |
| 270,000,000 | 2,481 | 0 | 21,380 | 10.40% | March 23, 2011 Patch |
| 260,000,000 | 1,513 | 0 | 18,285 | 7.64% | March 15, 2011 Patch |
| 250,000,000 | 1,219 | 0 | 17,940 | 6.36% | |
| 240,000,000 | 1,172 | 0 | 20,176 | 5.49% | |
| 230,000,000 | 956 | 0 | 21,217 | 4.31% | |
| 220,000,000 | 975 | 0 | 24,255 | 3.86% | |
| 210,000,000 | 1,244 | 0 | 68,244 | 1.79% | |
| 200,000,000 | 1,341 | 0 | 87,524 | 1.51% | December 17, 2010 Patch |
| 190,000,000 | 542 | 0 | 15,742 | 3.33% | December 10, 2010 Patch |
| 180,000,000 | 475 | 0 | 19,491 | 2.38% | |
| 170,000,000 | 415 | 0 | 21,716 | 1.88% | |
| 160,000,000 | 377 | 0 | 19,350 | 1.91% | October 27, 2010 Patch |
| 150,000,000 | 334 | 0 | 16,783 | 1.95% | |
| 140,000,000 | 235 | 0 | 5,181 | 4.34% | September 30, 2010 Patch |
| Total | 46,679 | 3,245,814 | 1,384,807 | 4,677,300 | Before May 23, 2012 |
Revised Unboxing Probability
p = 0.01 = 1%
Probability of getting at least 1 Unusual in 100 unboxing:
P(At least 1 Unusual | 100 unboxing) = 1 - (1 - 0.01)^100 = 1 - 0.99^100 = 63.40%
p = 0.00666... = (2/300) = 0.66...%
Probability of getting at least 1 Unusual in 100 unboxing:
P(At least 1 Unusual | 100 unboxing) = 1 - (1 - 0.00666...)^100 = 1 - 0.99333...^100 = 48.77%
p = 0.005 = 0.5%
Probability of getting at least 1 Unusual in 100 unboxing:
P(At least 1 Unusual | 100 unboxing) = 1 - (1 - 0.005)^100 = 1 - 0.995^100 = 39.42%
Accuracy
Unless the majority of Unusuals (>40%) reside in Private Backpacks while the majority of Uncrated Items (>90%) reside in Public Backpacks, the unusual rate is definitely not 1%.
Does unusual from Private Backpack surface or circulate over time?
Based on current data provided by Backpack.tf, 46,337 unusuals unboxed before May 23, 2012 are known.
Further Reading
http://wiki.teamfortress.com/wiki/Talk:Mann_Co._Supply_Crate#Unusual_drop_rate
News (March 30, 2013) News (March 26, 2013) |